The right upstream and supporting technology decides whether a beverage filling machine line runs efficiently, compliantly and profitably. In this guide Sunswell breaks down Total Cost of Ownership (TCO) for Beverage Filling Lines for B2B buyers planning or upgrading a production line.
The purchase price of a filling machine is often only 40–55% of what it truly costs over five years. A proper TCO model adds energy, consumables, spare parts, labour, downtime and financing to reveal the real cost per bottle. This 5-year model helps buyers compare a basic line against a higher-CapEx Combiblock on lifetime economics, not sticker price.
TCO = acquisition + installation + energy + water/chemicals + spare parts + labour + downtime + financing − residual value. Buyers who ignore OEE loss and power bills systematically overpay.
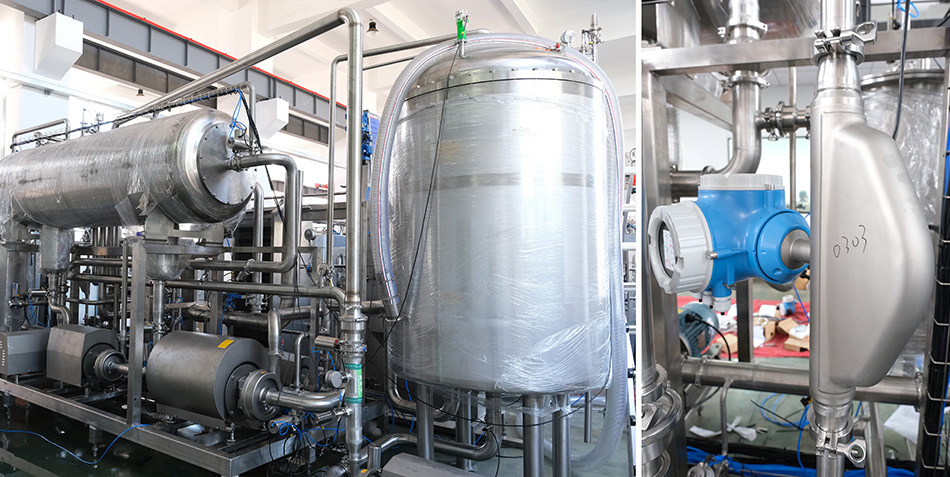
Energy and consumables dominate the tail. A Processing Equipment train with efficient CIP and VFD drives can save more over 5 years than the price gap between two filler tiers.
| Cost block | Basic line | Premium line |
|---|---|---|
| Acquisition + install | 100 | 140 |
| Energy (5 yr) | 38 | 26 |
| Spares + labour (5 yr) | 30 | 20 |
| Downtime loss (5 yr) | 25 | 8 |
| Total TCO | 193 | 194 |
Figures are indexed units; the point is that a dearer, more efficient line can match or beat a cheap line on TCO once energy and downtime are counted.
Estimate kWh/bottle from the supplier, then multiply by volume and tariff. Multiply unplanned downtime hours by margin-per-hour to quantify OEE loss. A robust conveyor system and water treatment design reduce both.
Leasing shifts CapEx to OpEx and changes the TCO shape; include interest and residual value. Model two scenarios before signing.
Cost per filled bottle over 5 years — it rolls energy, spares, downtime and CapEx into one comparable figure for any Combiblock option.
Request nameplate kWh, recommended spare-part list and MTBF; conservative inputs beat optimistic ones in a TCO model.
Model the true TCO of your filling machine and Combiblock with Sunswell.



 +86 13921964455
 [email protected]

A2 Dongjiu Industrial Park, 30 East Jintang Road, Tangshi, Zhangjiagang, Jiangsu 215600, China