The right technology and commercial decisions decide whether a beverage filling machine line runs compliantly, efficiently and profitably. In this guide Sunswell breaks down Bottled Water Plant Profit Margin Analysis for B2B buyers planning or upgrading a production line.
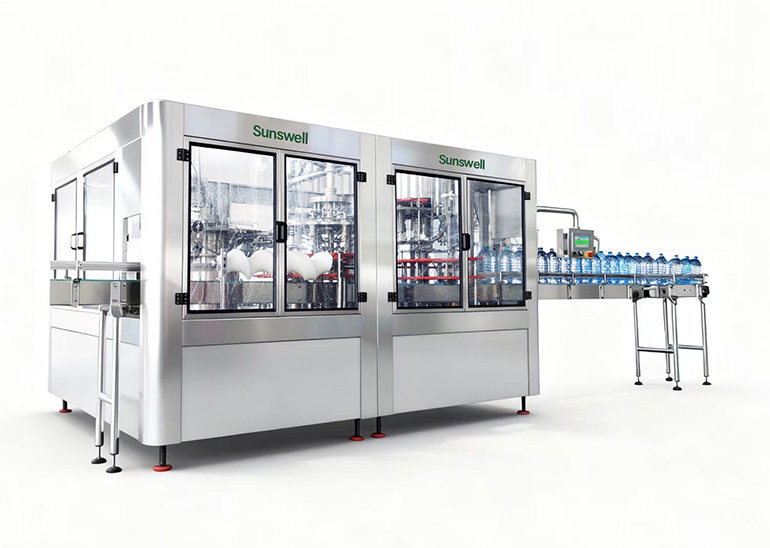
Bottled water looks simple, but margin lives in the details: resin cost, electricity, logistics and fill rate. A water filling machine plant breaks even only when volume clears fixed costs. This guide models real break-even scenarios so buyers size the right water production line.
Variable cost per bottle = preform + cap + water + energy + labour + logistics. Fixed cost = depreciation, rent, management. Margin = price − variable − allocated fixed.
Low utilisation is the biggest leak: a line running at 40% of nameplate spreads fixed cost over few bottles, crushing margin on your Water Treatment Systems investment.
| Capacity | Fixed/mo | Break-even utilisation |
|---|---|---|
| 6,000 BPH | Low | ~55% |
| 12,000 BPH | Medium | ~48% |
| 24,000 BPH | High | ~42% |
Illustrative; bigger lines need higher absolute volume but lower per-bottle fixed cost on a Combiblock.
Push higher-margin SKUs (large format, fortified) and lift utilisation; every point of uptime on the filling machine drops break-even.
Negotiate preform volume, use efficient CIP, and locate near market to cut freight.
Aim for 60%+ from year one; below ~45% most water plants struggle to cover fixed cost.
Yes — large PET and multi-serve formats usually carry better margin than small single-serve on the same line.
Model margin on your water filling machine line with Sunswell.



 +86 13921964455
 [email protected]

A2 Dongjiu Industrial Park, 30 East Jintang Road, Tangshi, Zhangjiagang, Jiangsu 215600, China